1 of 5 / Popular Diet Plans
View All
Don't Fall for Fad Diets
Get the real facts about fad diets, and learn some healthy weight loss strategies that really work.
High-Protein Diet for Weight Loss
Discover how high-protein diets may help you lose weight and feel full. Find out the best sources of protein for weight loss.
High-Protein, Low-Carb Diets
Learn how high protein/low carbohydrate diets work and their pros and cons for weight loss.
Rapid Weight Loss: Is It Safe?
Learn about rapid weight loss claims, types of diets, and the risks and benefits of rapid weight loss.
2 of 5 / Healthy Weight
View All
3 of 5 / Healthy Eating & Nutrition
View All
How to Get Your Vitamin D
Vitamin D is essential for healthy bones, and a lack of it can lead to health problems, including cardiovascular disease.
Are You Getting Enough Vitamin B12?
Vitamin B12 is essential for good health, but some people may not be getting enough.
What Are Phytonutrients?
Learn about the health benefits of phytonutrients, natural chemicals that are found in a variety of plant foods.
Types of Fiber and Their Health Benefits
There are several types of fiber. Each works differently in your body and gives you distinct health perks.
4 of 5 / Best & Worst Choices
View All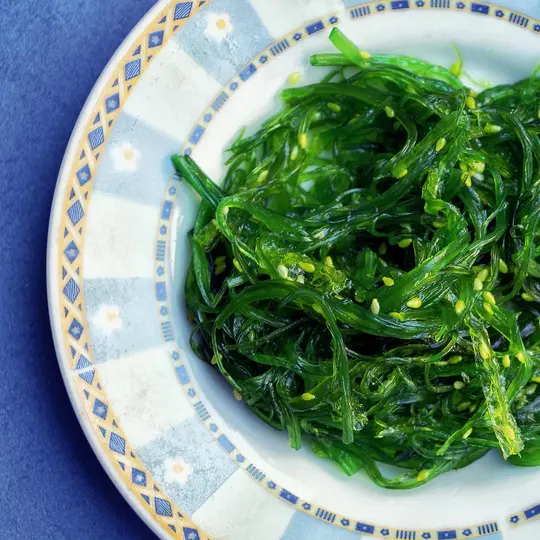
5 of 5 / Tools and Calculators
View All
Suggested Reads about Health & Diet
To Eat Less When Snacking, Pick the Best Size
Almost everyone who's watching their calories knows to bypass those family-size bags of snacks, with experts long warning us we’re likely to eat more than we planned. Now, new research suggests that the size of a snack matters. Bottom line: To eat less, pick the smallest-size snacks.
Emulsifiers Make Food Appetizing yet Bring Health Dangers
Emulsifiers don’t necessarily equal junk food. Such substances can be found in many foods that are often considered healthy, such as some low-fat Greek yogurts, trail mix bars, or oat milk.
Schools Should Drop Lunchables, Consumer Reports Says
Consumer Reports is calling on the U.S. government to remove Lunchables meal kits from school cafeterias that are subsidized by federal funds after testing by the advocacy group found concerning levels of sodium and heavy metals like lead.
Salt Substitutes Linked to Reduced Risk of Heart Problems
Swapping salt for salt substitute products in food may help protect people from early death and, particularly, from dying of heart problems like heart attack or stroke, according to researchers in Australia.
8 million+ Physician Ratings & Reviews
Find Doctors and Dentists Near You
You can also search by physician, practice, or hospital name